Moduel „Search“
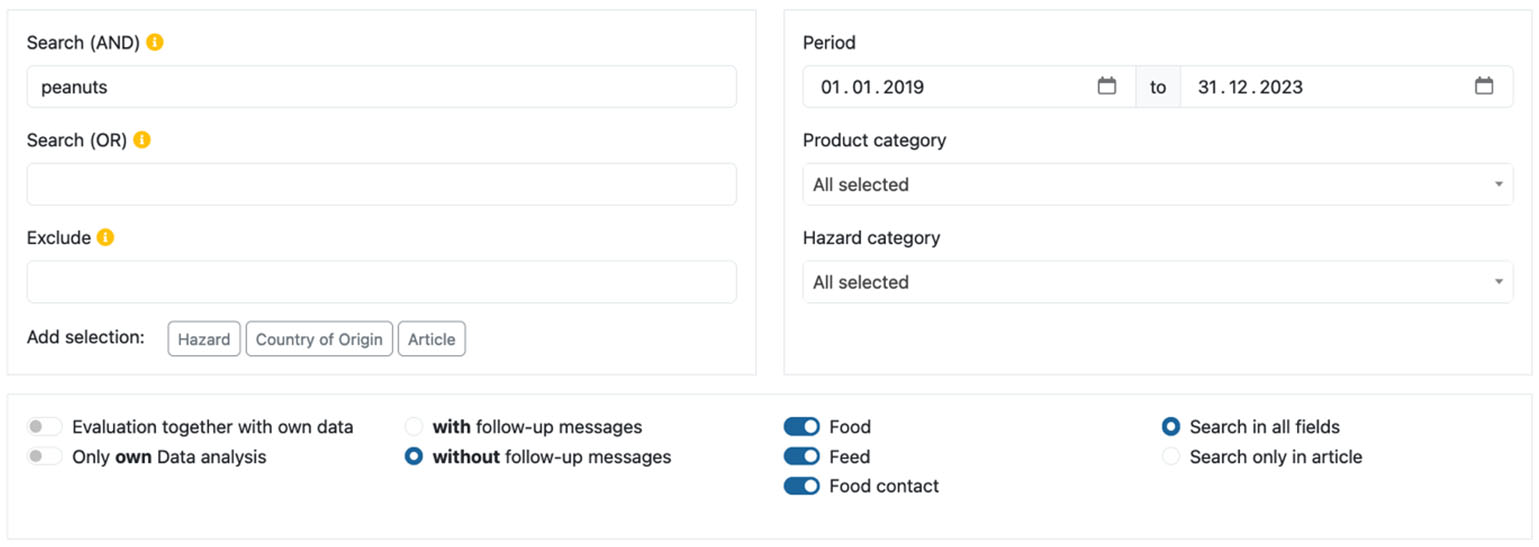
The query is made under the menu point “SEARCH”. A range of search functions (figure 2) are available to selectively search for notifications. Alternatively - or additionally - the data can be selected from predefined product categories and/or hazard categories. The query can be carried out with all available data or can be restricted by selectively accessing the data for "food", "feed" and/or "food contact materials". The results are presented in a risk landscape.
SAFEFOOD-ONLINE also allows to enter company-specific data. In the “Search” module, it is also possible to include this data in the evaluation.
If certain terms are to be excluded from the query, these terms can be entered in the “Exclude” field. If there are several terms, they are entered separated by a space.
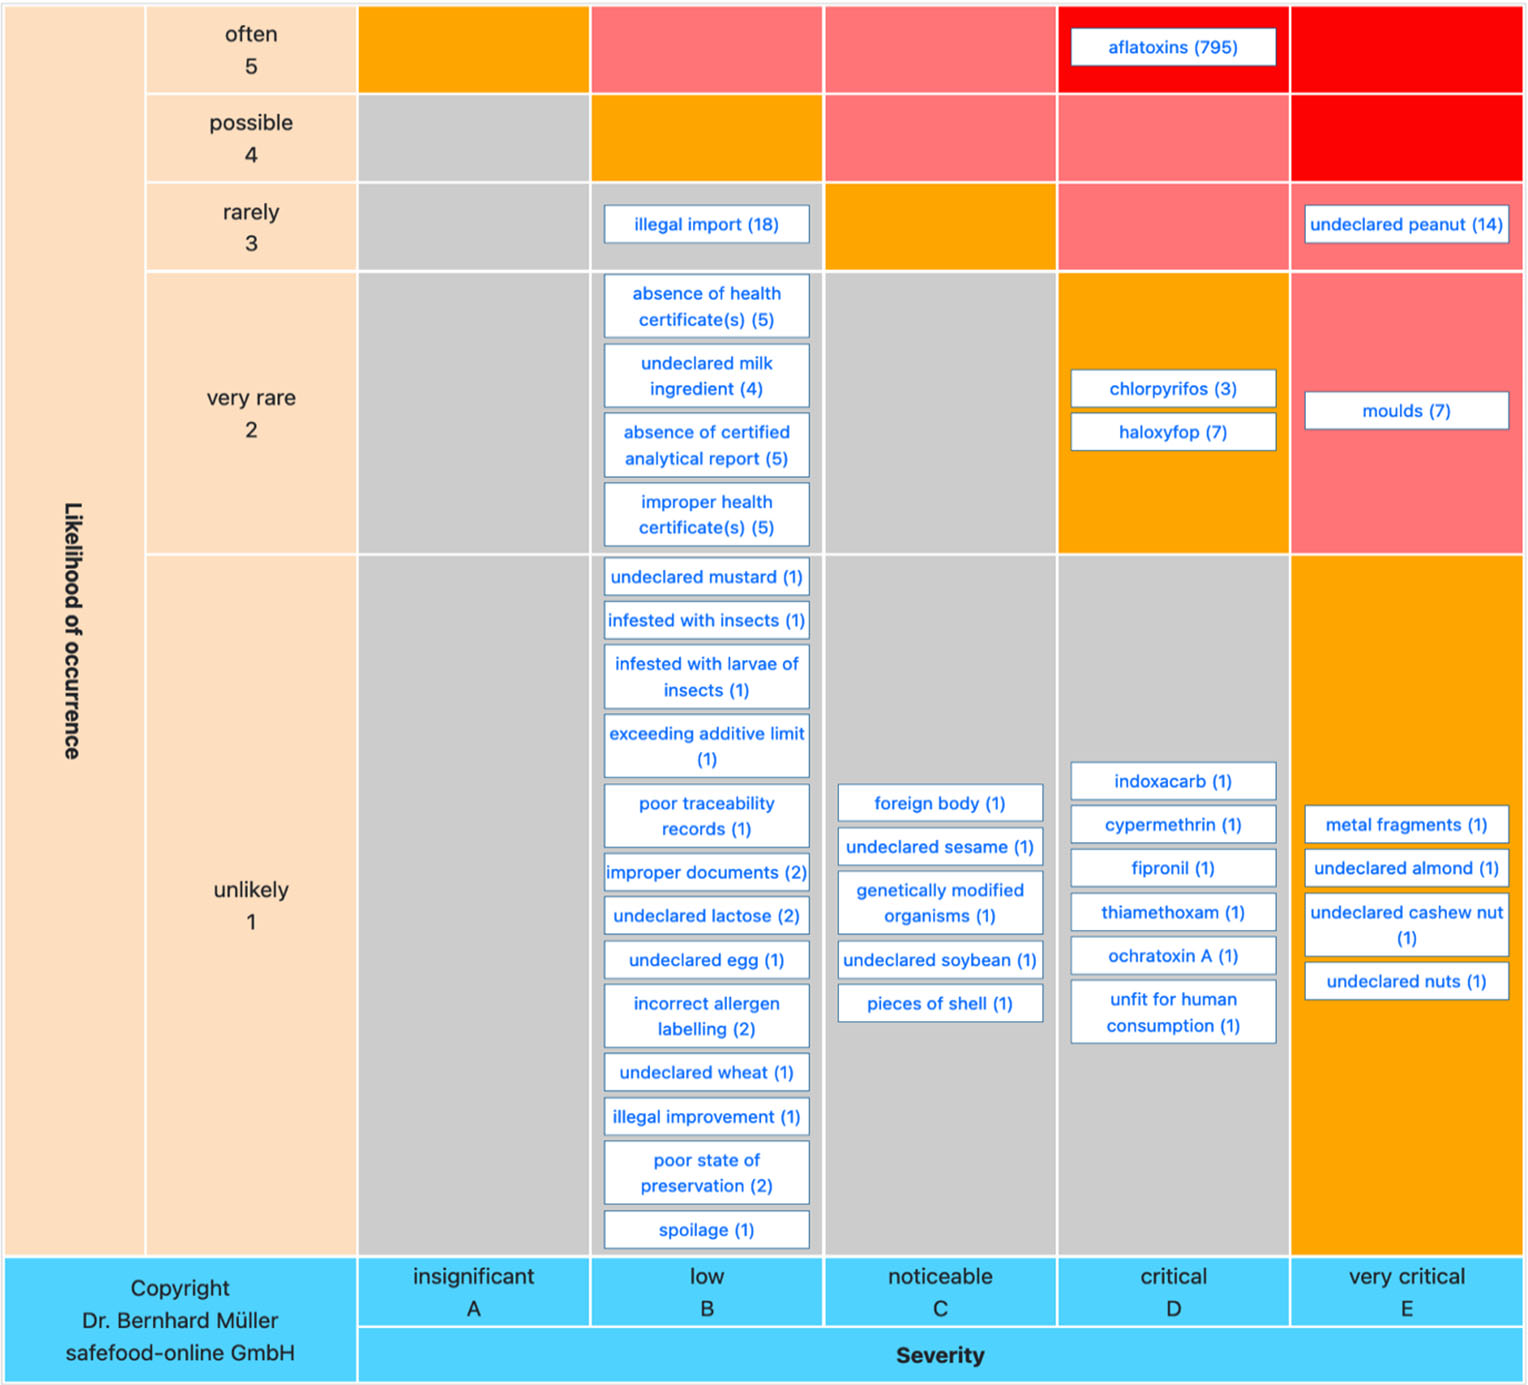
In the risk landscape (figure 3), the results are displayed according to the probability of occurrence and the severity of the impact. The gradation in frequency from unlikely to frequent results from the number of entries of the hazard from the database compared to all entries. For a rough orientation, the number of hits in the output is given in brackets.
The impact from insignificant to very critical is calculated according to the type of hazard. Details are described in the newsletter 2021-04 (April 2021 edition).
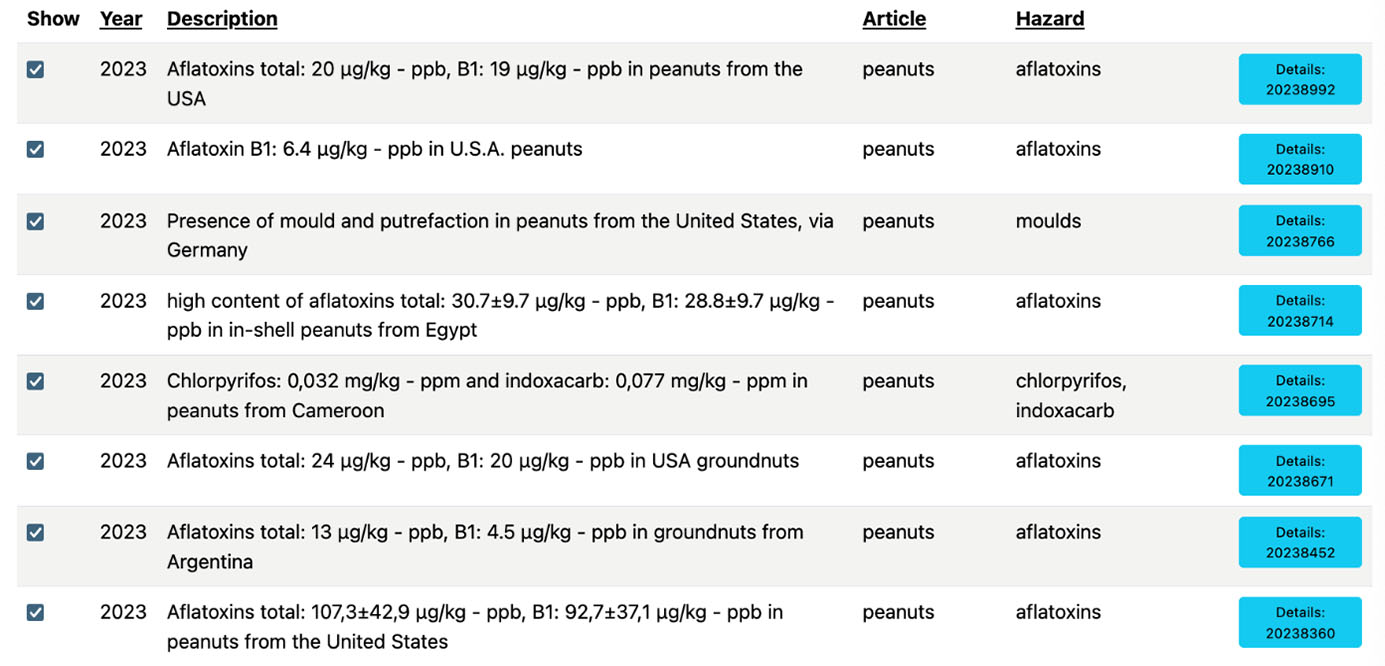
A table below the risk landscape shows the details of all notifications in the search query. Figure 4 shows an excerpt of the tabular results.
Generating trend statistics
Trend statistics can be created in addition to the query. Here it is possible to select the period individually.
There are several options for creating trend statistics:
a) Query by full years, e.g. as shown in figure 5 for the period 2003-2023.
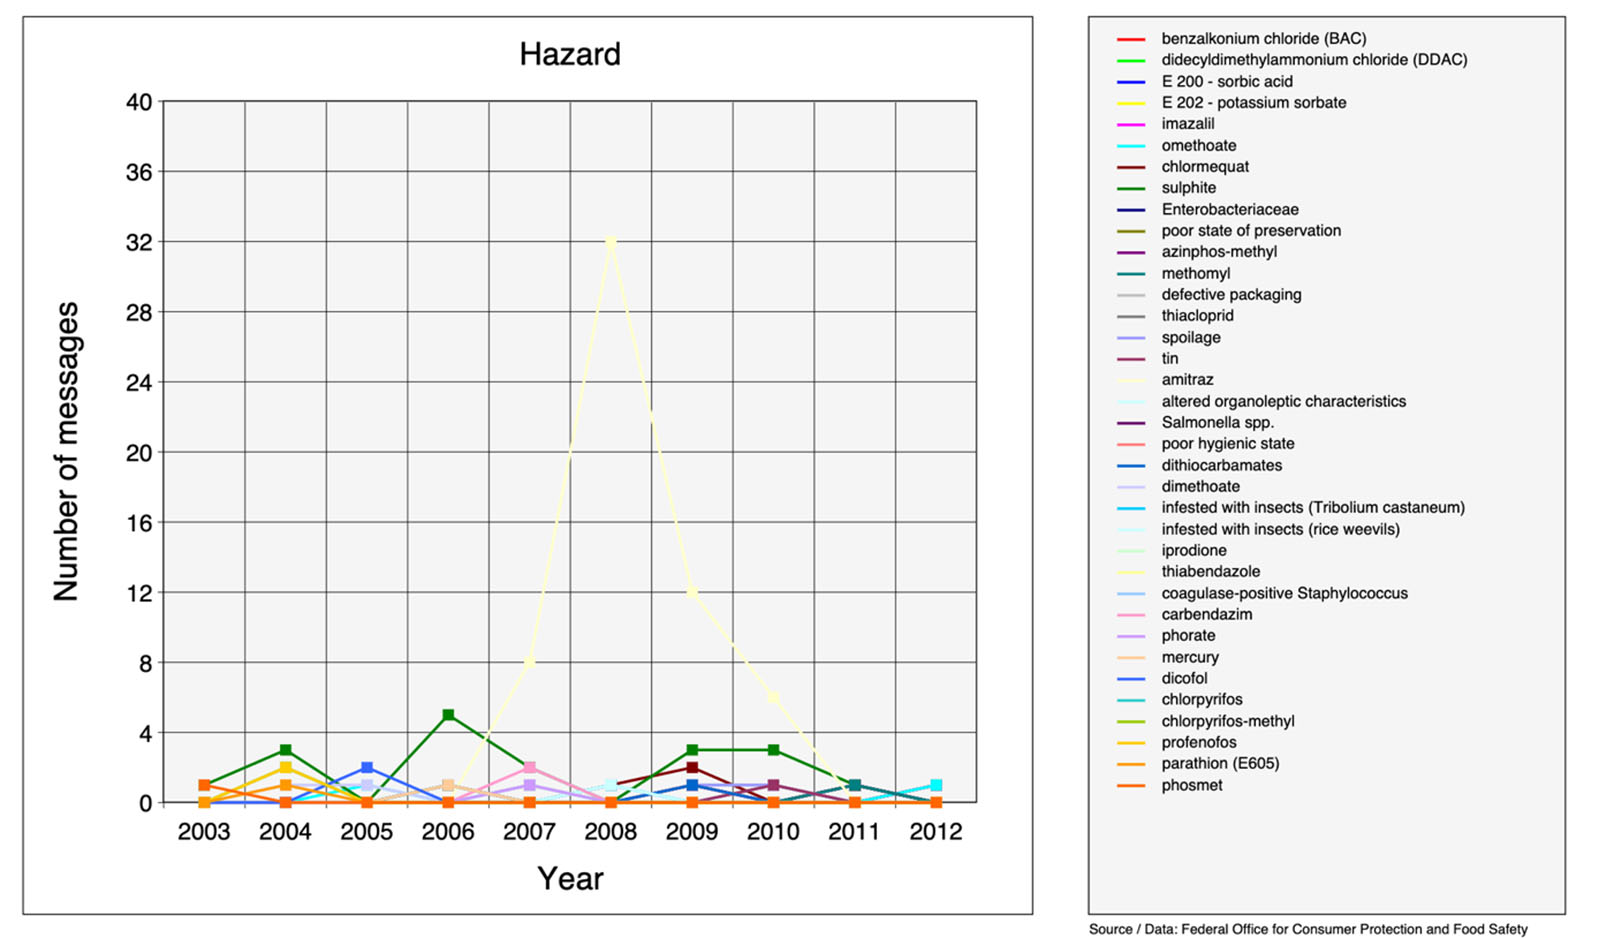
By pressing the "Trend by hazard source" button, the trend according to the selected years is given as a line graph. Trend statistics can be created according to hazard source, year, country of origin or article. Only one value is displayed on the x-axis for each year (see figure 6).
b) Query of individually selected time periods: After clicking on "Select more details" (see figure 5), the monthly details are taken into account in the graph displayed. The x-axis shows 12 values for each year (see example). The individual colors in the graph can be easily assigned with the help of the legend.


